
 Add to Chrome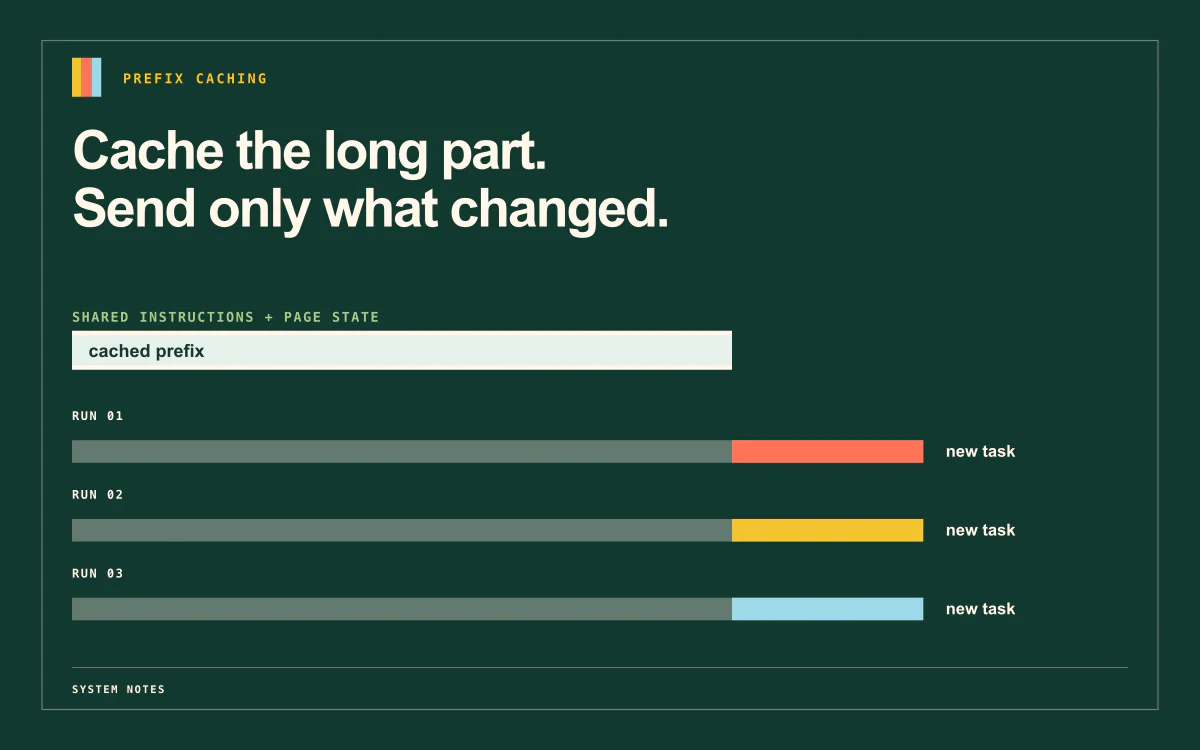
We caught our own product paying full price to re-read the same web page, over and over, within the same minute. One log line summed it up: on a single request, our agent sent the model about 318,000 tokens of context, and only 32,000 were recognized as "seen before." The other 286,000 billed at full price — for a page that had not changed since the previous request, fifteen seconds earlier.
This post is the engineering that followed: how DeepSeek's prefix cache prices requests, why a browser agent's prompt layout breaks it, and the specific changes that fixed ours.
The 50× coupon
An LLM API re-reads the entire conversation on every call — instructions, tool definitions, history, everything. For agents running long multi-step sessions, that re-read is the bill; output tokens are a rounding error next to it.
DeepSeek discounts any part of the request it has seen recently:
| Model | Cache hit | Cache miss | Output |
|---|---|---|---|
| DeepSeek V4 Flash | $0.0028 | $0.14 | $0.28 |
| DeepSeek V4 Pro | $0.003625 | $0.435 | $0.87 |
USD per 1M tokens, from DeepSeek's published API pricing.
A hit on Flash costs 1/50th of a miss; on Pro, 1/120th. Recognized tokens are effectively free — the unrecognized ones are the entire bill.
The rule is strict: the discount applies from the first byte of the request up to the first character that differs from a recent request, and not one character further. There is no partial credit. A single changed character a third of the way in bills the remaining two-thirds as brand new.
So the whole game is packing the prompt like a suitcase: what never changes at the bottom, what always changes on top. We thought we were doing that. We were not.
Why DeepSeek and not Gemini
An aside on scope, since we run Gemini in production too. Gemini's default discount is implicit caching: Google decides what to cache, and you find out afterwards from a usage field. In our logs it was unreliable in ways we couldn't engineer against — byte-identical retries seconds apart reporting zero recognized tokens, long stretches of no discount at all — and the hit rate depended on the endpoint: prompts built by the same code were recognized at ~58% through the consumer API key and ~6% through Vertex AI. Same models, same bytes, roughly ten times the discount, decided by which front door the request used. (Explicit caching recognized 99.9% of stored text in our tests, but it bolts a cache-object inventory — minting, versioning, hourly storage billing — onto every prompt edit.)
DeepSeek's cache has no handles, no TTLs, no storage line item: one strict, published rule, applied automatically. You can engineer against a rule — test it, measure it, alarm on it. The rest of this post is that engineering.
Browser agents are a worst case
A browser agent's request is dominated by the page snapshot — a serialized map of the page in which every interactive element gets a numbered label. On real pages it is routinely 80% of everything we send. And pages fidget: a points counter ticks, a "2 hours ago" rolls over, one new element renders at the top and every numbered label after it shifts by one. Under a first-divergent-character rule, a 99%-similar page can price like a 95%-different one.
We measured how much two snapshots of the "same" page actually share, from the start:
| Two snapshots of… | Matching prefix |
|---|---|
| Same Amazon results page, minutes apart | 2–5% |
| Two pages on the same site (shared nav bar) | ~0% |
| Same page, agent working it seconds apart | 37% → 97% |
| Same page, genuinely untouched | 100% |
The last two rows are the exploitable ones. When the agent doesn't touch the page between looks — it was writing to a spreadsheet, or double-checking its work — the snapshot comes back byte-identical. The question is whether the request layout lets those passes actually hit.
The suitcase was packed wrong
Ours didn't, because the request was arranged in storytelling order:
Who you are → What you've done so far → What the page looks like now → What to do nextThe action history — the diary — grows on every step; that's the point of it. So the snapshot — the map — behind it sits at a different offset on every request. Same bytes, different position: to a strict prefix rule, a brand-new document. That's the log line at the top of this post: the instructions matched, the diary had one new entry, and the enormous map behind it re-billed in full.
The fix is one line of surgery: put the map before the diary. The map sits at a fixed offset and matches perfectly when the page is unchanged; the diary grows behind it, where growing is harmless. (We designed a fancier scheme first — snapshots "floating" at their first-capture position, the server diffing to decide placement. The dumb version captured the entire win.)
The discount runs from the start of the request until the first block whose bytes changed. Flip the layout and watch the page snapshot fall in or out of the discount.
Try it: with history → snapshot, the snapshot never gets discounted — the growing history in front of it pushes it to a new position every pass, even when the page is identical. That was our bug.
Smaller fixes rode along, all the same principle:
| What was wrong | Why it broke the chain | Fix |
|---|---|---|
| Per-step instructions inside the fixed instruction block | Rewrote character zero every step | Moved to the end |
| URL printed above each page map | A changed tracking param spoiled the whole map | URL goes below |
| Tool definitions assembled in arbitrary order | Same tools, different bytes | Sorted, always |
| "Last active 42 seconds ago" | A random number wearing a label | Bucketed to "just now" |
| Timestamps mid-request | Different every request, by definition | Dead last |
One regression is worth keeping. Hours after the reorder, an agent halfway through a job application decided it could no longer see the page — in reading order, a snapshot printed before your actions reads like it predates them — and spent six rounds taking screenshots of a page it was already holding. The fix was one sentence at the end of the request, where attention is sharpest: the snapshot above was captured for this turn; trust it. A prompt layout is a contract with two parties, the cache and the model. Renegotiate with one, inform the other.
Weigh it on the real tokenizer
DeepSeek publishes its tokenizer as a downloadable package, which let us weigh candidate encodings of the snapshot instead of guessing. On a real 2.6-million-character snapshot:
| Change tested | Result |
|---|---|
| Two-space indent → one-space | 1 token saved out of 622,740 |
| Two-space indent → tabs | Thousands of tokens worse |
| Machine-structured text vs prose | Structure is meaningfully cheaper per character |
Encoding choices that look expensive to a human are often free (runs of spaces merge into single tokens), and the expensive ones are invisible — weigh the actual payload before redesigning anything.
One flag, two caches
Our strangest miss: the agent makes an action call, then an extraction call that deliberately replays the action call's entire conversation. Character-for-character identical prefix, verified — and it never got the discount. Not once.
The culprit was a request setting: the extraction call asked for JSON mode. One flag difference files the request under a different cache segment — same bytes, different universe, no match, and nothing in the response says why. We found it by sending the same prompt twice with one parameter changed and watching one hit and one miss.
The rule: calls that should share a cache must be identical in their settings, not just their text. We dropped JSON mode — the instructions and the parser enforce the format anyway — and the extraction call went from paying full freight to riding the previous call's prefix almost entirely. One of the biggest single wins in this post, from deleting one line.
Notes instead of re-sends
DeepSeek's reasoning output is long and specific — "the upload button is 9385," "Post is 5954, currently grayed out." We keep all of it, verbatim, in the append-only diary. When a later step needs something from a page seen three steps ago, the model cites its own note ("element 25, from step 0, tab 0") and we resolve the reference from stored snapshots server-side — no old map re-enters the conversation. The notes are billed once and re-read at 1/50th price forever after.
Cache Volatility Tiers
"Sort by how often it changes" is a proxy. What the discount actually rewards is how many requests share the bytes — and the two disagree exactly where it's expensive. The layout we converged on has four shelves, top to bottom:
| Shelf | What lives there | Shared by | Changes |
|---|---|---|---|
| 1 | The instructions | every user, every task | when we deploy |
| 2 | This user's tool definitions, skills, profile | every task this user runs | when they change a setting |
| 3 | The original request, attached files, recordings, and the append-only diary | every step of this task | never — it only grows |
| 4 | The page map, per-step feedback, the clock | this step only | every step |
Sort by shelf first. Sort by change frequency only within a shelf.
Now the correction. "Map before diary," measured over 442 consecutive planner passes, turned out to be right for one of our two agents and wrong for the other. Our step-by-step worker reads small maps — around 1,500 tokens — of pages it usually didn't touch between looks; for it, map-before-diary wins. Our planner's map comes back with different bytes on 73% of passes, while its diary is append-only on 100% of them. Map-before-diary stalled the planner's discount at the instructions on roughly three passes in four, re-billing a median of ~14,000 tokens of unchanged diary behind a changed map — the mistake from the top of this post, wearing the opposite costume. In mid-August we flipped the planner to diary-before-map. Same principle, opposite answer, because the question is never "what changes most?" It's "what will the next few requests have in common?"
The shelf audit caught three more items on the wrong shelf:
- Our worker's task-specific "answer" tool — its definition embeds this task's output schema — sorted alphabetically near the front of the tool list, dragging every per-user tool definition from shelf 2 down to shelf 3. One day of logs: 18 users, 80 distinct tool lists. Task-specific tools go last.
- The original request (never changes) rode at the end of every step next to the per-step feedback (always changes), so the stable half re-billed with the volatile half. Split them.
- Tool results read like per-step output, but the moment a step ends they're diary: append-only and cache-eligible. Ours were already placed right; the metering that flagged them made us check.
Where the cache lives
The layout was necessary. It was never sufficient. When we moved our managed traffic to a second provider running the same open weights, byte-identical, well-packed prompts cached the instructions and nothing else: this provider's cache lives on the machine that served your previous request, and ours were being spread across the fleet. Picture a building with a thousand receptionists, every visit routed to whichever desk is free — everyone efficient, nobody remembering you. After their team added routing to keep a conversation on the same cluster, history-bearing passes went from 36% to 74% cached past the instructions within the hour; the weighted hit rate went from 63% to 80%, with a median of ~20,000 extra tokens per pass riding at the discount.
The mechanism is the OpenAI-compatible prompt_cache_key field: the provider hashes it and routes matching requests to the same machine. Choosing the value took three drafts. Keyed per conversation, follow-ups improved exactly as hoped — planner second-pass diary recognition went from 23% to 60%, and the worker's later passes halved their full-price tokens from ~15,000 to ~8,000 per pass — but every new conversation became a fresh sample of the pool, and on one quiet Saturday 39% of planner first passes got zero discount on a ~40,000-token instruction block (under 1% the Friday before). The random spread we'd eliminated had been quietly keeping shelf 1 warm on every machine. Keyed per user, first passes recovered — 85% of new conversations start within ten minutes of the same user's previous request, 98% for workers — but one user's hash can land on a slow machine, and the key then faithfully keeps all of their traffic there.
The Receptionist Pool
The scheme we landed on (our provider's own suggestion) is a small pool of desks instead of a personal one:
prompt_cache_key = "codeplan-v6:shard-" +
                   (HMAC(user_id + ":" + trajectory_id) % 8)
Reading it right to left:
% 8— all traffic for this workload shares eight desks, instead of one per user. A heavy user's tasks spread across the pool, so no single slow machine can capture them; a brand-new task lands on a desk that everyone else's traffic has been keeping warm, so even a first pass finds the instructions cached.HMAC(user_id + ":" + trajectory_id)— a task always hashes to the same desk, so its growing history stays where its memory lives; and because only the shard number ships, the key carries no user identifier at all.codeplan— one pool per kind of request. A desk's memory is valuable because of the shared instructions at the top of the request, so only requests with the same instructions should share a pool.v6— the prompt version. Ship new instructions, bump the tag: one clean cold start, instead of two eras of instructions fighting over the same memory.
Shelf one gets a shared pool, shelf three gets a stable desk, and the luggage tag went through three drafts — the conversation's name, the user's name, and finally no name at all. A shelf number and a lane.
The receipts
Everything below was measured on real tasks, against the real DeepSeek API, reading the discount straight off the bill.
Share of input tokens the provider recognized as already-seen. Grey = old layout, colour = new.
The middle bar is the honest one: the LinkedIn task involves a composer modal that genuinely rebuilds the page on half its steps, and those steps should miss. The job-application task, where the agent works a stable form, lands at 87% discounted across the whole task — 867,000 input tokens for about $0.019 instead of $0.12. Cache hits also skip a chunk of prefill, so responses start noticeably faster.
What this is worth for your own agent is snapshot size × rounds × hit rate:
Input tokens only — output is billed separately and caching does not touch it.
Instrumentation is the feature
None of this was a trick. It was measurement. A cache regression throws no error, fails no test, and changes no behavior — the only symptom is an invoice, a month late and fifty times larger. The defense is instrumentation that reports exactly which character broke the chain, and automated tests that fail loudly when a code change re-packs the suitcase wrong.
Next: element labels that survive page changes (so a 99%-similar page finally gets 99% credit instead of 5%), skipping the snapshot entirely when we can prove a page hasn't changed, and streaming the long calls so a slow desk can never again masquerade as a dead one.
A prompt isn't a document. It's a suitcase: what never changes at the bottom, what always changes on top — and weigh it on every trip. We decided we wanted nothing but the cache.


